
“I was shown my visual field results, but I can’t tell whether these numbers are good or bad.”
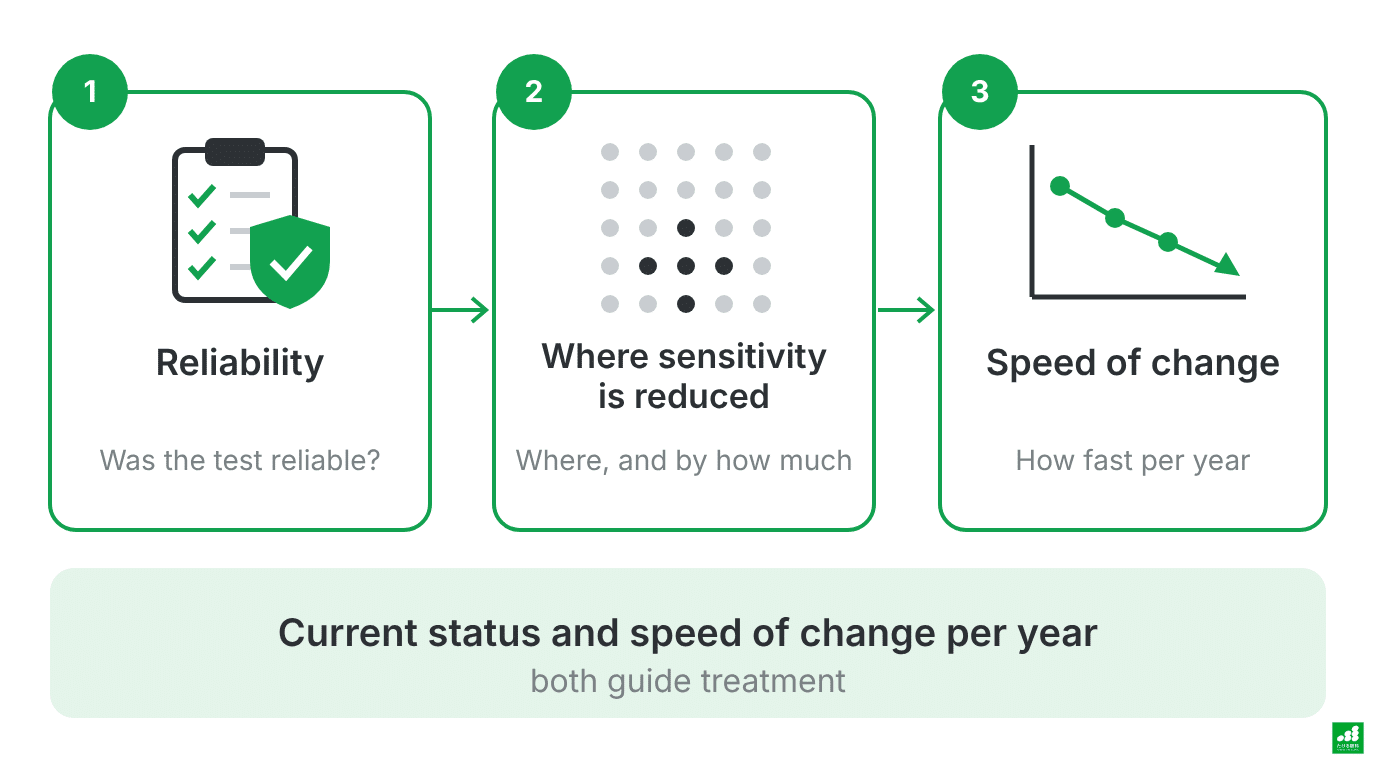
What matters most for treatment planning is the current state of the visual field and how quickly it changes over time.
What a visual field test measures
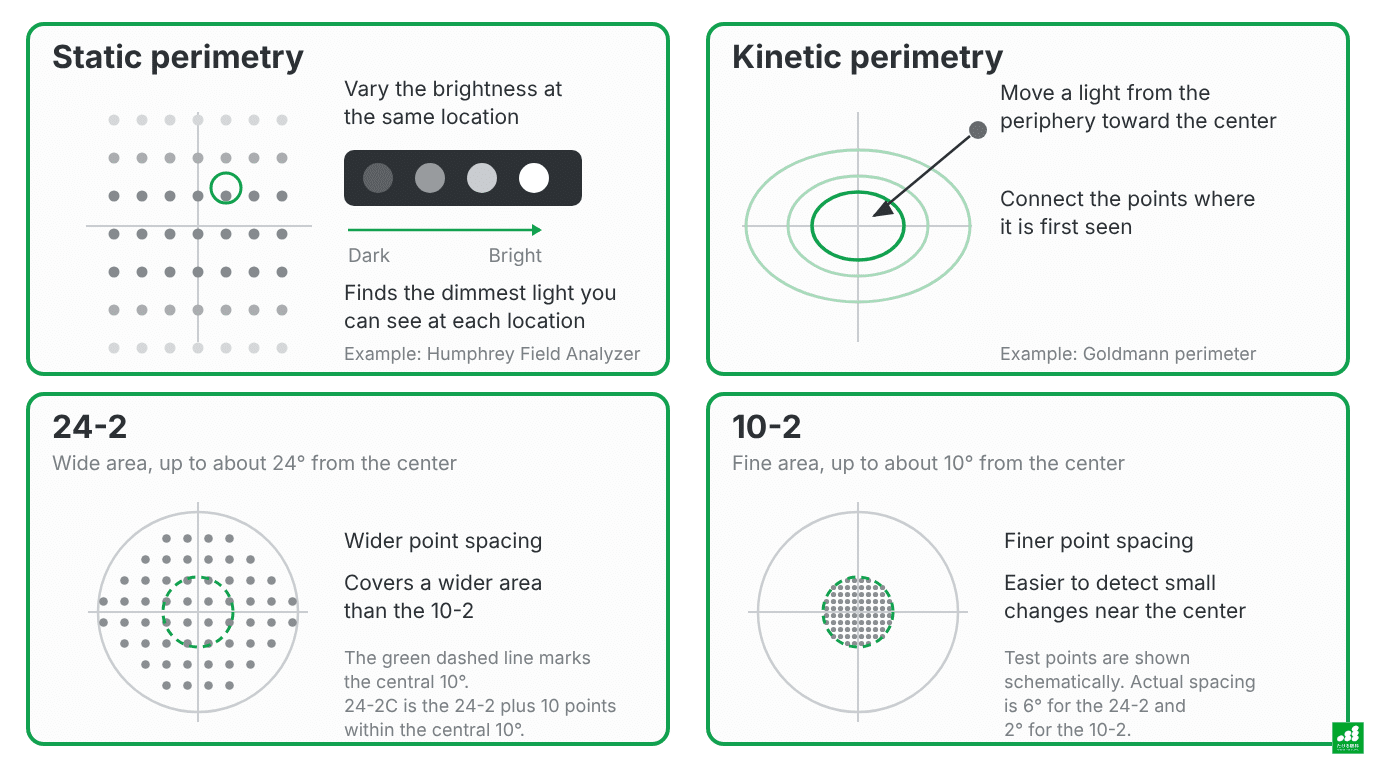
In static perimetry with the Humphrey Field Analyzer, you look at a single point straight ahead in a dark room and press a button whenever you see one of the small lights that appear in different places in your field of view. The brightness of the light is varied to find how dim a light you can see at each location.
Results are expressed as “sensitivity” at each test point, in dB (decibels). A higher number means you can see a dimmer light (higher sensitivity).
Visual field tests come in two types: static and kinetic. The differences between these types, and between the 24-2 and 10-2 programs, are shown in the figure below.

The Humphrey Field Analyzer and the 24-2C program
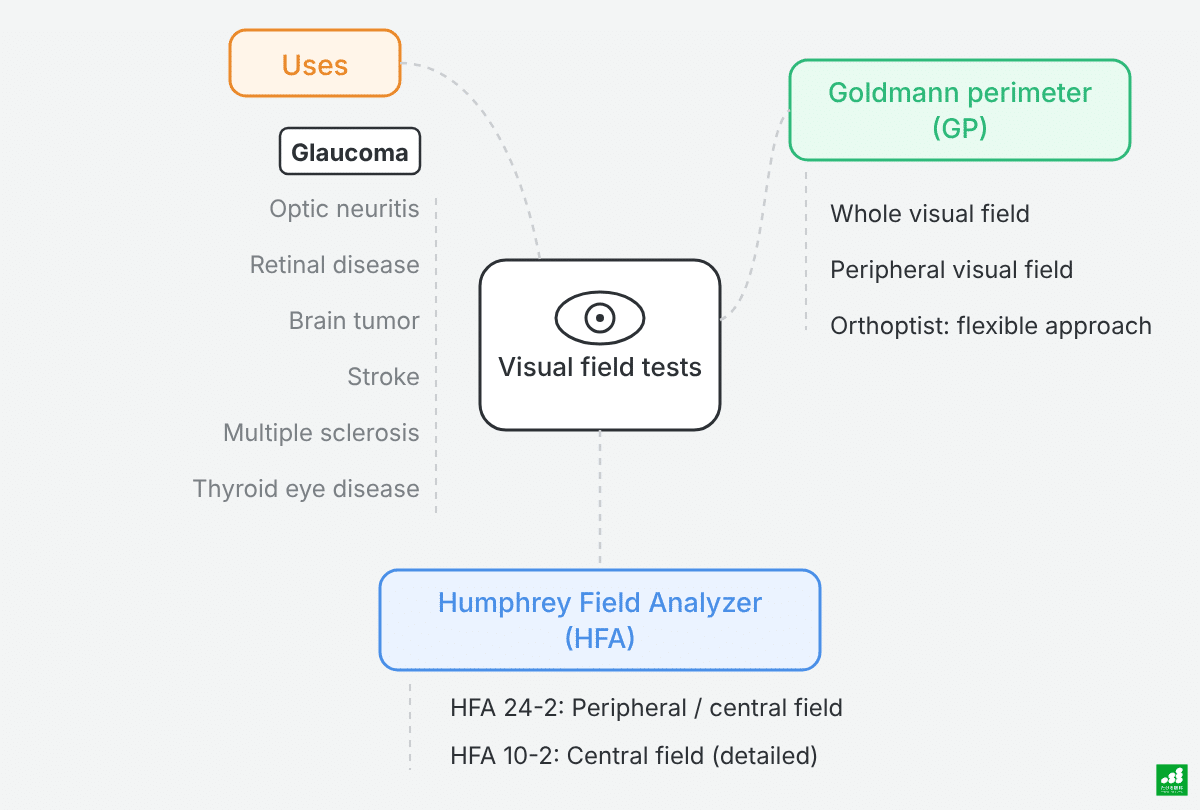
Visual field tests are performed with the 24-2C program of the ZEISS Humphrey Field Analyzer (HFA). The 24-2C is the standard 24-2 test with 10 additional points within the central 10°1.
A rapid testing algorithm is used, and the area near the center is examined in more detail than with the conventional 24-2.
The Humphrey Field Analyzer is the mainstay for following glaucoma. Goldmann perimetry (kinetic perimetry) is used when a wider area of the visual field needs to be examined, when the Humphrey test is difficult to perform, or when glaucoma is very advanced. A certified orthoptist adjusts the procedure to suit how you see.
The printout contains a grayscale map, probability maps, and several numbers. You do not need to understand all of them.
Deciding on an order in which to look at them helps you grasp the whole picture.
- Is the test reliable?
- Where, and by how much, has sensitivity decreased?
- How much has it changed since the previous test?
First, check: the reliability of the test
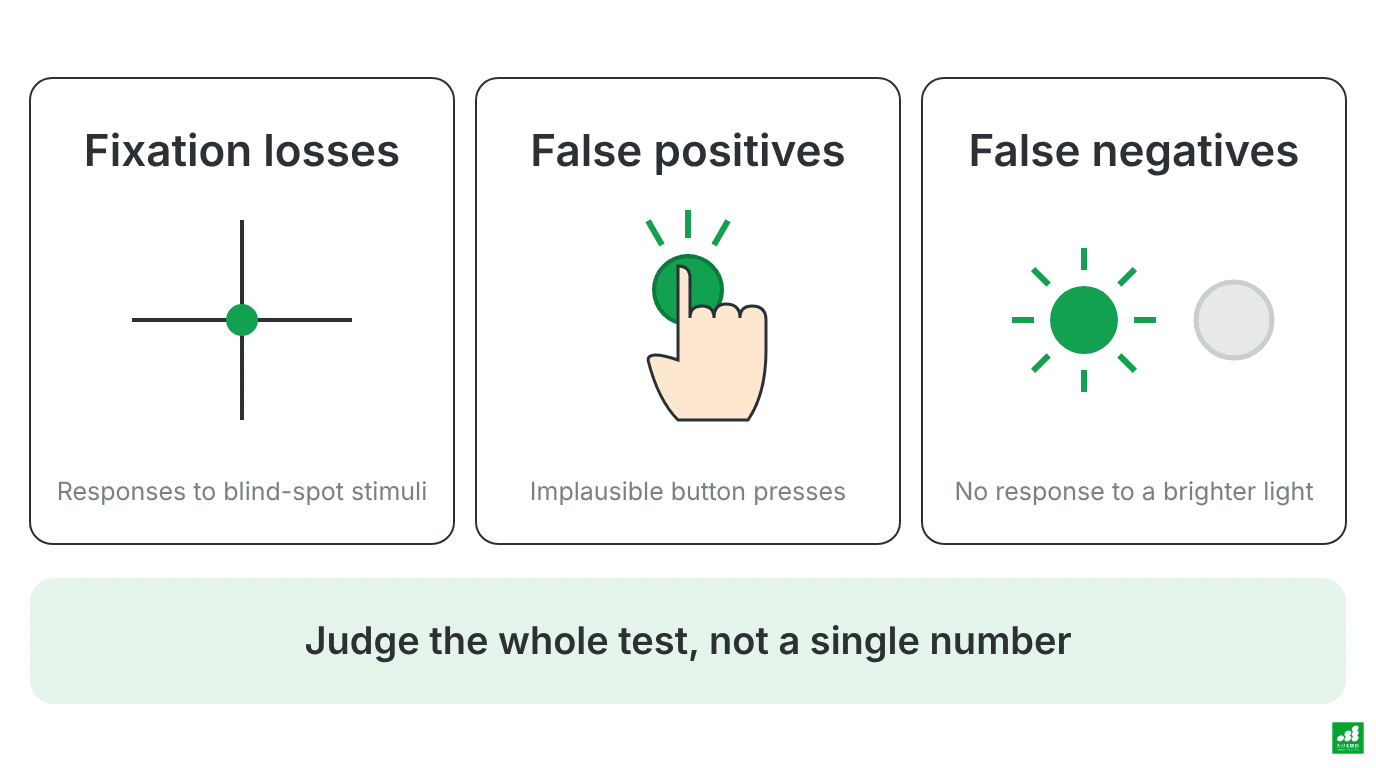
Reliability is checked from unnecessary button presses, eye movements, and how the test went2. The indices displayed vary with the test method and settings. With SITA Faster, the measurement of false negatives and of fixation losses using the blind spot are usually omitted.
The main indices are as follows:
- Fixation losses: the proportion of responses to lights presented at the blind spot, a part of the visual field that normally cannot see. This is a guide to how steady your gaze was.
- False positives: the proportion of button presses made at moments when a response to a light is unlikely.
- False negatives: the proportion of times you failed to respond to a light brighter than one you had already seen at the same location.
It has long been thought that a test with many false positives is unreliable. However, a 2022 study repeated testing in the same people using several methods.
It found that the false-positive rate had only a small association with the test results, and that the factor with a relatively larger influence was severe glaucoma. The authors of that study suggested that the acceptable range for the false-positive rate may need to be reconsidered3.
If one number exceeds a cutoff, the test is not simply judged unusable. It is judged together with the eye-tracking record, how the test went, and the results as a whole.
When a result is poor, it is not judged from a single test. In judging progression, confirming with repeat tests whether a change is real is considered important4.
Especially at a first test, results may be unstable because you are not yet used to it. A baseline for comparison is built from several results.
Right after diagnosis, a shorter interval between tests is recommended in order to establish baseline results4,5.
Next, check: where and by how much sensitivity has decreased
The grayscale is a map that shows the measured sensitivity as shades of gray. Darker areas indicate lower sensitivity.
This does not mean that the dark areas actually look black to you.
Total deviation and pattern deviation are each shown as numbers and as a probability map.
- Total deviation: the difference in sensitivity at each point compared with normal values for people of the same age
- Pattern deviation: total deviation adjusted for the effect of an overall decrease in sensitivity (for example, from cataract), which makes localized decreases easier to see
Glaucomatous loss of sensitivity often appears as an arc-shaped area in the upper or lower part of the visual field. However, the shape alone does not establish glaucoma.
Visual field abnormalities can have causes other than glaucoma, so the result is interpreted together with other examination findings.
Testing one eye at a time can reveal a loss of sensitivity that you do not notice in daily life. Being able to notice such changes is the value of having visual field tests.
Where to look on the printout
The positions of items and the way they are displayed on the printout differ with the output format and settings. In general, the main items are arranged roughly as follows:
- Top: the type of test (such as 24-2C) and the reliability indices
- Left: the sensitivity values at each test point, and the grayscale
- Center to bottom: total deviation and pattern deviation (numbers and probability maps)
- Right: summary values such as MD and VFI
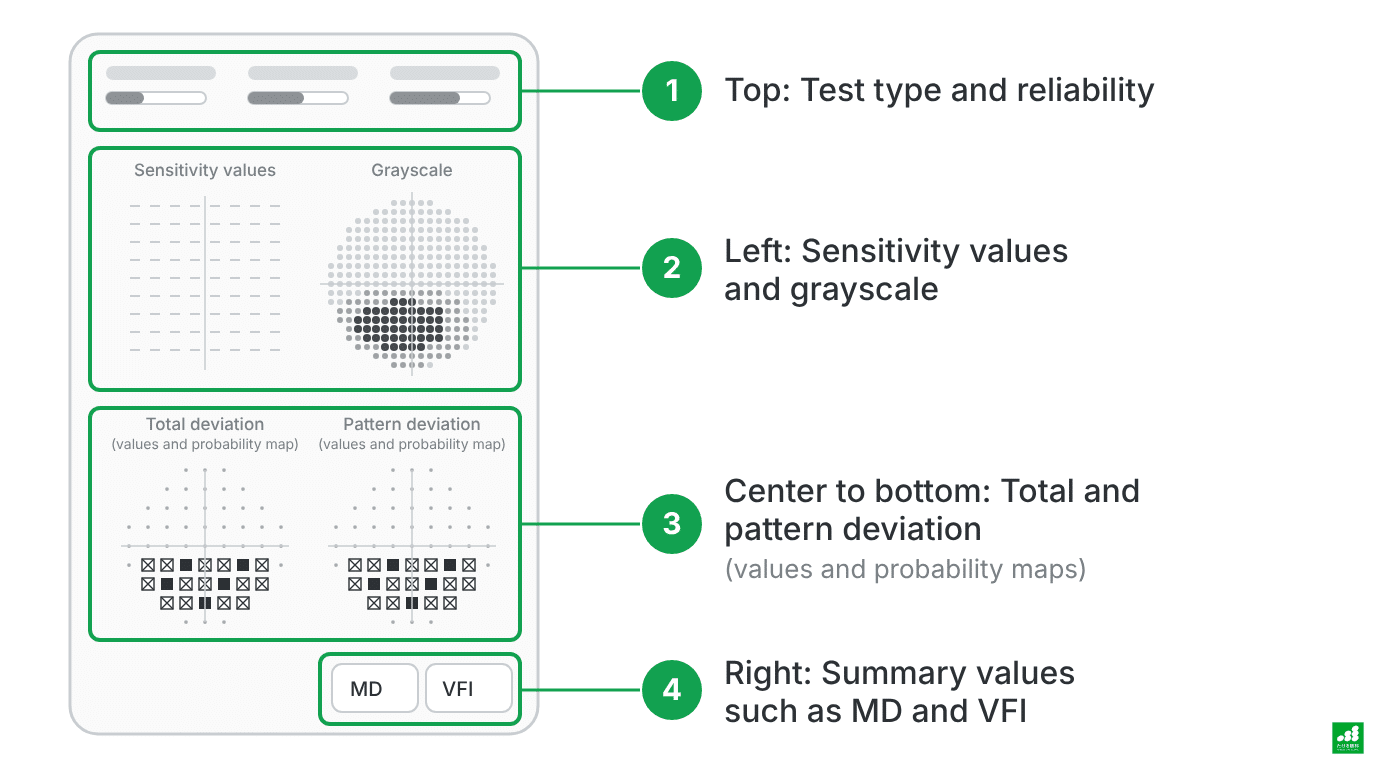
A schematic of the main items on the printout. Some elements, such as the numerical deviation values, are omitted. The position and display of items vary with the output format and settings.
A probability map uses the darkness of the symbols to show how unusual a decrease is compared with normal people of the same age. Darker symbols indicate a decrease that is uncommon in normal people of the same age2.
The total deviation probability map shows the overall state, including a general decrease caused by conditions such as cataract. The pattern deviation probability map shows the localized decrease after the general decrease has been adjusted for, which helps identify changes caused by glaucoma.
In addition to MD, the printout lists PSD (Pattern Standard Deviation) and GHT (Glaucoma Hemifield Test)2. PSD indicates how uneven the visual field is, and GHT indicates the difference in sensitivity between the upper and lower halves of the visual field.
MD, PSD, and GHT are not judged by any single index; they are read together with the shape of the map.
The recommended order is reliability first, then the shape of the grayscale and probability maps, then the numbers. Starting with the numbers draws attention to the overall average and makes it easy to overlook differences between locations.
Looking at the numbers: MD and VFI
Of the numbers, MD and VFI are the ones most often used to follow changes over time.
MD (Mean Deviation) expresses, in dB, the degree of decreased sensitivity across the whole tested area compared with normal people of the same age6. Around 0 dB is a rough guide for normal, and the more negative the value, the greater the overall decrease in sensitivity tends to be.
VFI (Visual Field Index) summarizes the state of the visual field with extra weight on the central area, and is expressed with normal as 100%7. It does not mean that a given percentage of your visible area or of your everyday function remains.
Because MD summarizes the whole tested area, a deep local loss of sensitivity may not show up much in the number. In addition to the numbers, the probability maps and the grayscale are used to check where sensitivity has decreased and how far it extends.
The 10-2 test for examining the central area in detail
A number that summarizes the tested area may not reveal changes close to the point you are looking at. When the central area needs to be checked more closely, the “10-2,” which examines a narrow area at finer spacing, may be added8,9.
The 24-2C also has more test points near the center, but the density of test points differs from that of the 10-28,9. The 24-2 can miss defects near the center9,10. Tests are combined according to where sensitivity has decreased and how the condition has progressed.
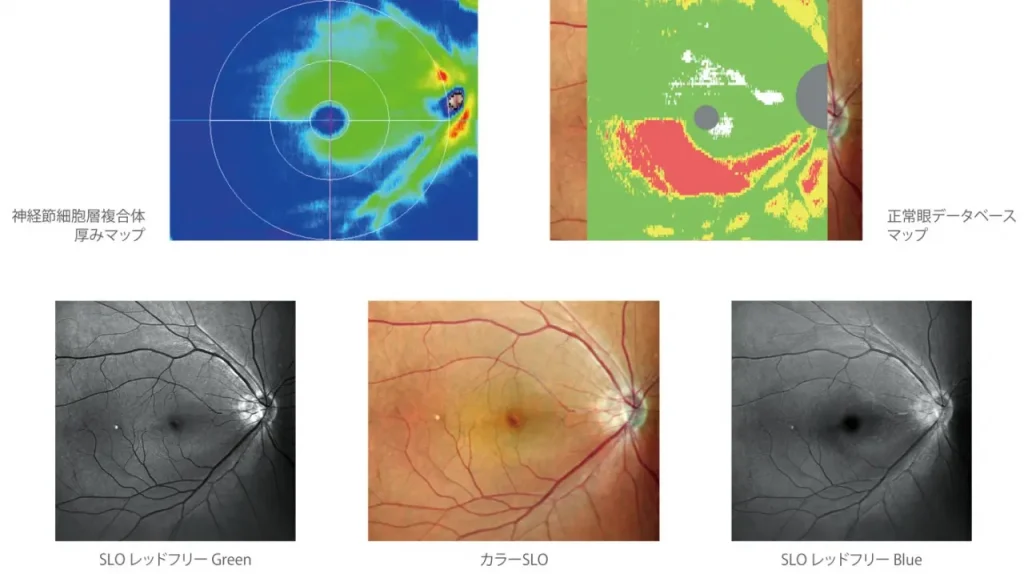
The state of glaucoma is judged by combining visual function, shown by the visual field test, with structural changes in the nerve, shown by OCT (optical coherence tomography).


What matters most: the speed of change
For MD and VFI, what matters is not a single value but the slope when the same test is repeated over time. The speed of progression is expressed in dB/year for MD and %/year for VFI.
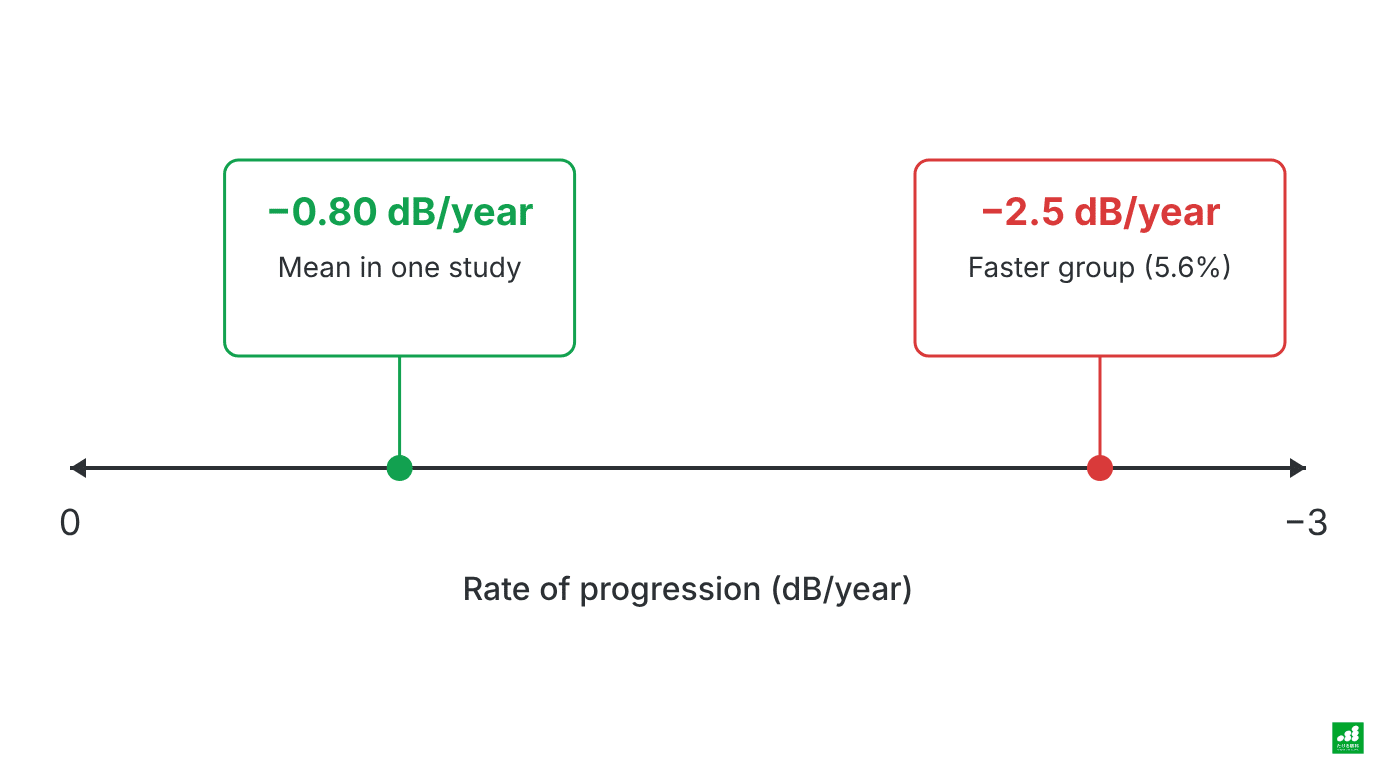
In a Swedish clinical-care study that followed 583 patients with primary open-angle glaucoma or exfoliation glaucoma for an average of 7.8 years, MD changed by an average of −0.80 dB/year (the worse eye was used when both eyes qualified). However, individual variation was very large, and 5.6% of patients declined by more than 2.5 dB per year11. These are results in the study participants, and they do not directly indicate your own speed of progression or your treatment target.

Treatment lowers the risk of progression, but progression can still occur during treatment12. For this reason, regular testing is continued.
In a French study, over a mean observation period of 8.4 years for the study as a whole, significant progression by VFI slope analysis was detected in 159 (49.7%) of 320 treated eyes with primary open-angle glaucoma13.
How fast is acceptable depends on the person, according to age, the current state of the visual field, and expected remaining lifespan. For people expected to live with the condition for a long time, even the same speed can add up to a larger loss and may have a greater effect on future vision.
There is no uniform standard; your own values are reviewed at your visit.
What is GPA (Guided Progression Analysis)?
The printout may show “GPA” or “Guided Progression Analysis.” GPA is an analysis function that compares past tests and gives clues for judging progression2.
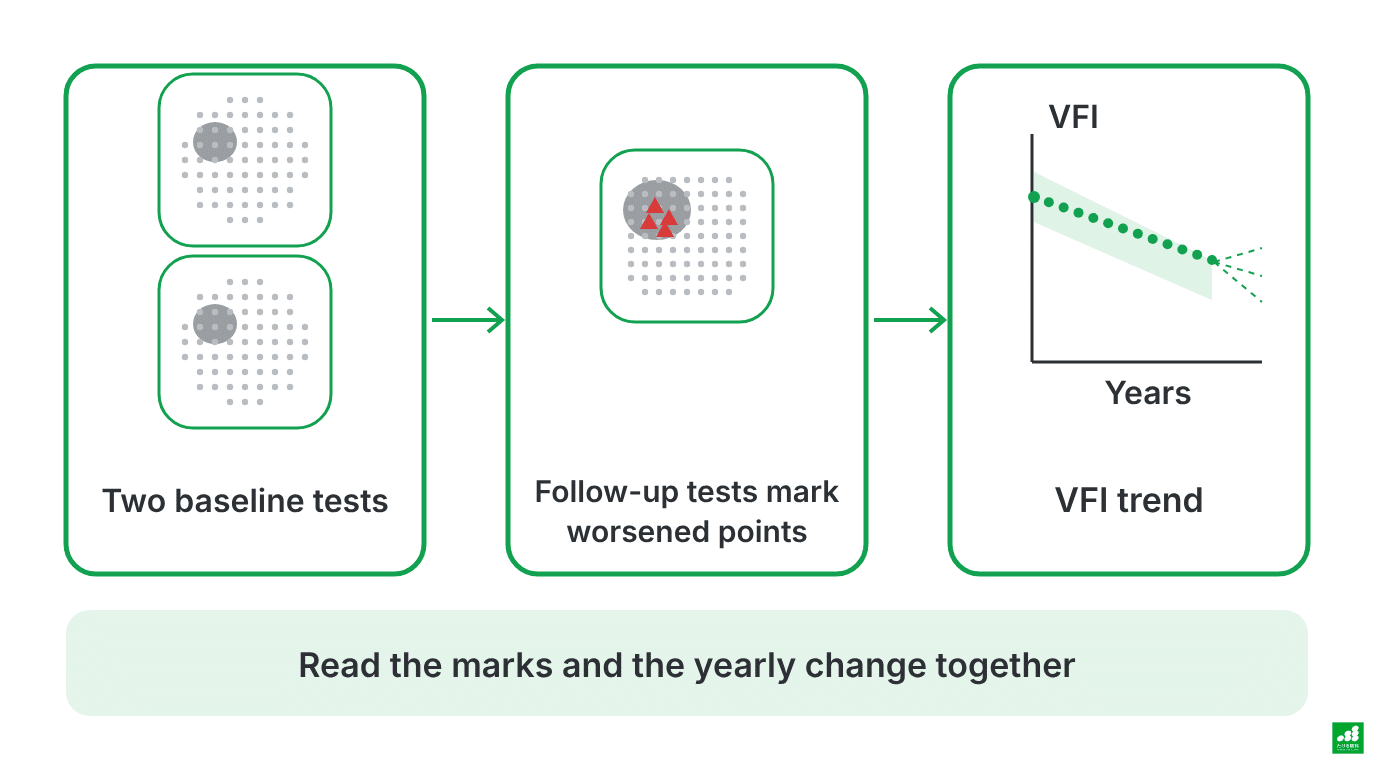
A schematic. The dotted line is an estimate if the same trend continues, not a confirmed prediction.
- Marks points that have worsened beyond the usual test-to-test variability, compared with two baseline tests
- Shows the change per year (%/year) from the slope of VFI over repeated tests
In the GPA Summary printout, the two baseline tests are at the top, the VFI trend is in the middle, and the most recent test is at the bottom. In other output formats, the layout and arrangement differ.
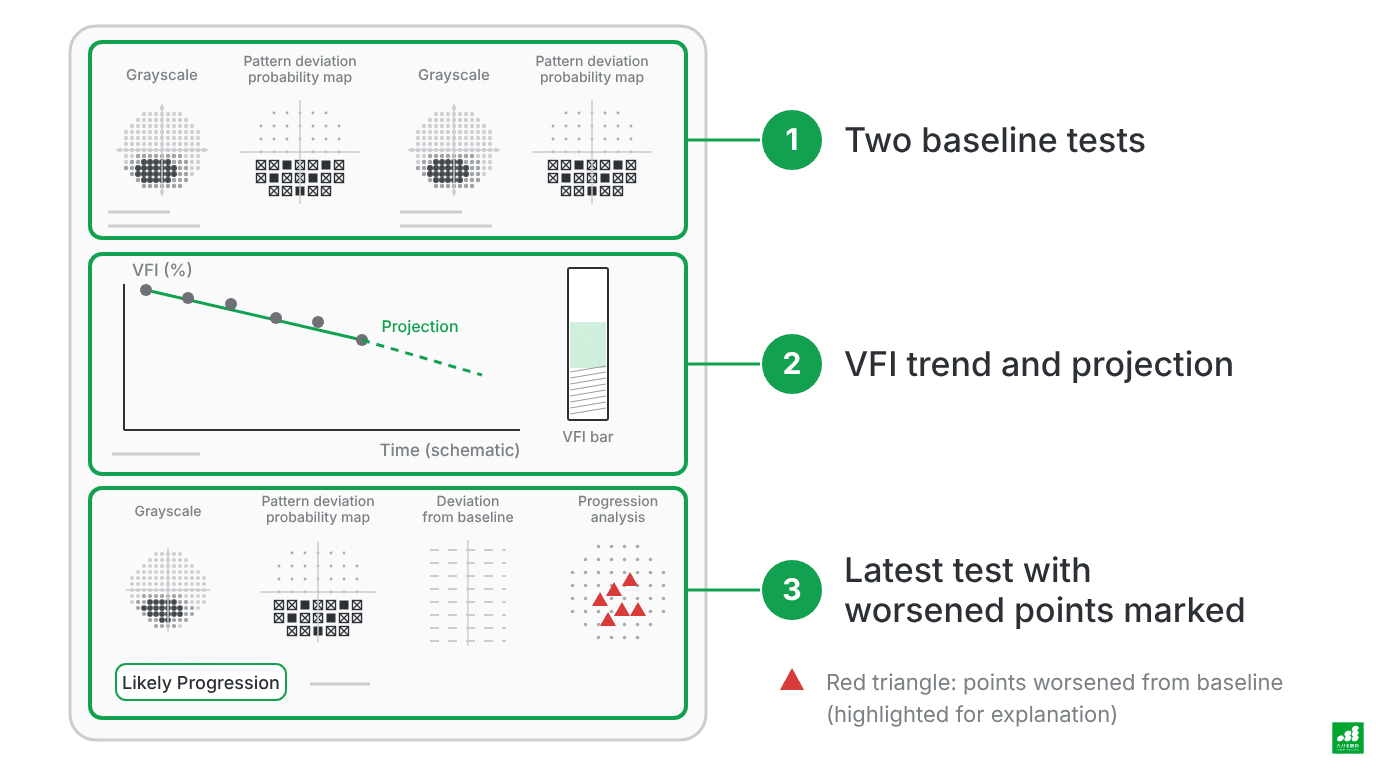
A schematic of the main layout of the GPA Summary. This is not an actual result or patient data. The red triangle is for emphasis in the explanation. “Likely Progression” indicates worsening confirmed repeatedly over several tests. The dotted line is an estimate that assumes the same change continues, not a confirmed prediction.
When worsening is repeatedly confirmed in later tests compared with the two baseline tests, a message indicating progression is displayed. The number of tests and the conditions required differ between the progression judgment and the slope analysis. When a change is flagged, whether it is clinically meaningful worsening is judged together with the available slope analysis and other examination findings4.
The treatment plan is based not only on the machine’s judgment but also on factors such as intraocular pressure and the condition of the optic nerve.
What to consider when progression is fast
When progression is found to be fast, the first things to check are as follows.
1. Is the test result a true change?
Visual field results fluctuate with physical condition, fatigue, familiarity with the test, spectacle prescription, the degree of cataract, and other factors. A single worsening cannot tell you whether the progression is real.
We check whether changes in the same direction continue over repeated tests4.
2. Is the target intraocular pressure appropriate?
Large trials have shown that treatment that lowers intraocular pressure reduces the risk of progression12. We check whether the current intraocular pressure has reached the target, and whether the target itself needs to be reviewed.
Because intraocular pressure also fluctuates over the course of a day, a single measurement is not used to decide.

3. How eye drops are used and continued
Eye drops may not work sufficiently if doses are missed, if the way of instilling them is off, or if they are interrupted because of side effects. How you actually use them is checked at your visit.
If the drops are hard to use or your eyes feel uncomfortable, please tell us rather than putting up with it. Changing the type of drop or the number of times a day may make it easier to continue.

4. Consider additional treatment
When intraocular pressure does not reach the target even after the drops are reviewed, selective laser trabeculoplasty (SLT) may be considered as needed. How SLT works and how effective it is are summarized in this article.



The interval between tests is set according to the stage of the disease and the speed of progression. When progression seems fast, tests are repeated at short intervals to assess the slope more reliably4.
Tips for taking the test
The visual field test can feel difficult until you are used to it. Common sticking points and what to do about them are as follows:
- When you are not sure whether you saw the light: press when you think you saw it. There is no need to press by guessing.
- When the test is long and tiring: you can take a break during the test. Tiredness in the later part can make results worse, so tell the staff if anything bothers you partway through.
- When you are not used to the test the first time: results may be unstable at first. Results can change as you get used to the test, so it is repeated to confirm4,5
- When your glasses or contact lens prescription does not fit: this affects the result, so the prescription is checked before the test.
Visual field tests can be booked online or through LINE.

If you have any concerns, please tell us at your visit.
Frequently asked questions
I was told that my “visual field results are poor.” Will I lose my sight?
A poor number reflects the current state of your visual field. What happens in the future depends on the current state, plus how fast it progresses from here and your age.
Even when progression is slow, the effect on future vision differs depending on the current state of the visual field and your age. What matters is knowing your own speed.
My numbers were worse than last time. Does that mean it has progressed?
A single worsening is not enough to say that it has progressed. Tests vary with physical condition and familiarity.
We judge after confirming whether changes in the same direction continue over repeated tests4.
Does a cataract change the results?
It can. MD is affected by the overall decrease in sensitivity caused by cataract.
Pattern deviation and VFI are designed to reduce the influence of cataract6,7. However, the influence cannot be removed completely, so the condition of the cataract is also checked at your visit.
I haven’t noticed any areas where I can’t see well. Do I still need to keep having the test?
Because the two eyes compensate for each other, a change in one eye is hard to notice. Visual field changes can be found even before you have any symptoms.
There is value in following the course before symptoms appear.

Can a visual field that has been lost come back?
Visual field changes from glaucoma are considered difficult to recover with current treatment. The goal of treatment is therefore to slow progression and preserve your vision for life5.
Summary
The current state of the visual field and the speed of change per year determine treatment decisions.
- Read visual field results in this order: reliability, where sensitivity has decreased, and change from the previous test.
- MD and VFI summarize the state of the tested area; read them together with the probability maps and the grayscale.
- Judge the numbers not only by a single value but also by the slope across repeated tests.
References
- Yamane MLM, Odel JG. Introducing the 24-2C visual field test in neuro-ophthalmology. J Neuroophthalmol. 2021;41(4):e606-e611. doi:10.1097/WNO.0000000000001157 https://doi.org/10.1097/WNO.0000000000001157
- Carl Zeiss Meditec. HFA3 Instructions for Use. 2660021167323 Rev A. 2018. https://www.zeiss.com/meditec/en/myzeiss/instructions-for-use/perimetry.html
- Heijl A, Patella VM, Flanagan JG, et al. False positive responses in standard automated perimetry. Am J Ophthalmol. 2022;233:180-188. doi:10.1016/j.ajo.2021.06.026 https://doi.org/10.1016/j.ajo.2021.06.026
- Chen RI, Gedde SJ. Assessment of visual field progression in glaucoma. Curr Opin Ophthalmol. 2023;34(2):103-108. doi:10.1097/ICU.0000000000000932 https://doi.org/10.1097/icu.0000000000000932
- Japan Glaucoma Society, Guidelines Revision Committee. Japanese Glaucoma Guidelines (5th edition). Nippon Ganka Gakkai Zasshi (J Jpn Ophthalmol Soc). 2022;126:85-177. (in Japanese) https://www.ryokunaisho.jp/guidelines/data/5_guidelines_all.pdf
- Palakkamanil MM, Nicolela MT. The rates of visual field progression in glaucoma and its clinical importance. Rev Bras Oftalmol. 2022;81:e0102. doi:10.37039/1982.8551.20220102 https://doi.org/10.37039/1982.8551.20220102
- Bengtsson B, Heijl A. A visual field index for calculation of glaucoma rate of progression. Am J Ophthalmol. 2008;145(2):343-353. doi:10.1016/j.ajo.2007.09.038 https://doi.org/10.1016/j.ajo.2007.09.038
- Chakravarti T, Moghadam M, Proudfoot JA, Weinreb RN, Bowd C, Zangwill LM. Agreement between 10-2 and 24-2C visual field test protocols for detecting glaucomatous central visual field defects. J Glaucoma. 2021;30(6):e285-e291. doi:10.1097/IJG.0000000000001844 https://doi.org/10.1097/IJG.0000000000001844
- WuDunn D, Takusagawa HL, Rosdahl JA, et al. Central visual field testing in early glaucoma: a report by the American Academy of Ophthalmology. Ophthalmology. 2024;131(2):240-248. doi:10.1016/j.ophtha.2023.10.008 https://doi.org/10.1016/j.ophtha.2023.10.008
- De Moraes CG, Hood DC, Thenappan A, et al. 24-2 visual fields miss central defects shown on 10-2 tests in glaucoma suspects, ocular hypertensives, and early glaucoma. Ophthalmology. 2017;124(10):1449-1456. doi:10.1016/j.ophtha.2017.04.021 https://doi.org/10.1016/j.ophtha.2017.04.021
- Heijl A, Buchholz P, Norrgren G, Bengtsson B. Rates of visual field progression in clinical glaucoma care. Acta Ophthalmol. 2013;91(5):406-412. doi:10.1111/j.1755-3768.2012.02492.x https://doi.org/10.1111/j.1755-3768.2012.02492.x
- Heijl A, Leske MC, Bengtsson B, et al. Reduction of intraocular pressure and glaucoma progression: results from the Early Manifest Glaucoma Trial. Arch Ophthalmol. 2002;120(10):1268-1279. doi:10.1001/archopht.120.10.1268 https://doi.org/10.1001/archopht.120.10.1268
- Aptel F, Aryal-Charles N, Giraud JM, et al. Progression of visual field in patients with primary open-angle glaucoma: ProgF study 1. Acta Ophthalmol. 2015;93(8):e615-e620. doi:10.1111/aos.12788 https://doi.org/10.1111/aos.12788